
The Candle Tracker
A meditation on time and energy. Adjust the burn rate to see how the flame's intensity shifts, transforming raw potential into visible light. This interactive module simulates the atmospheric output of a metaphysical light source.
Energy Output
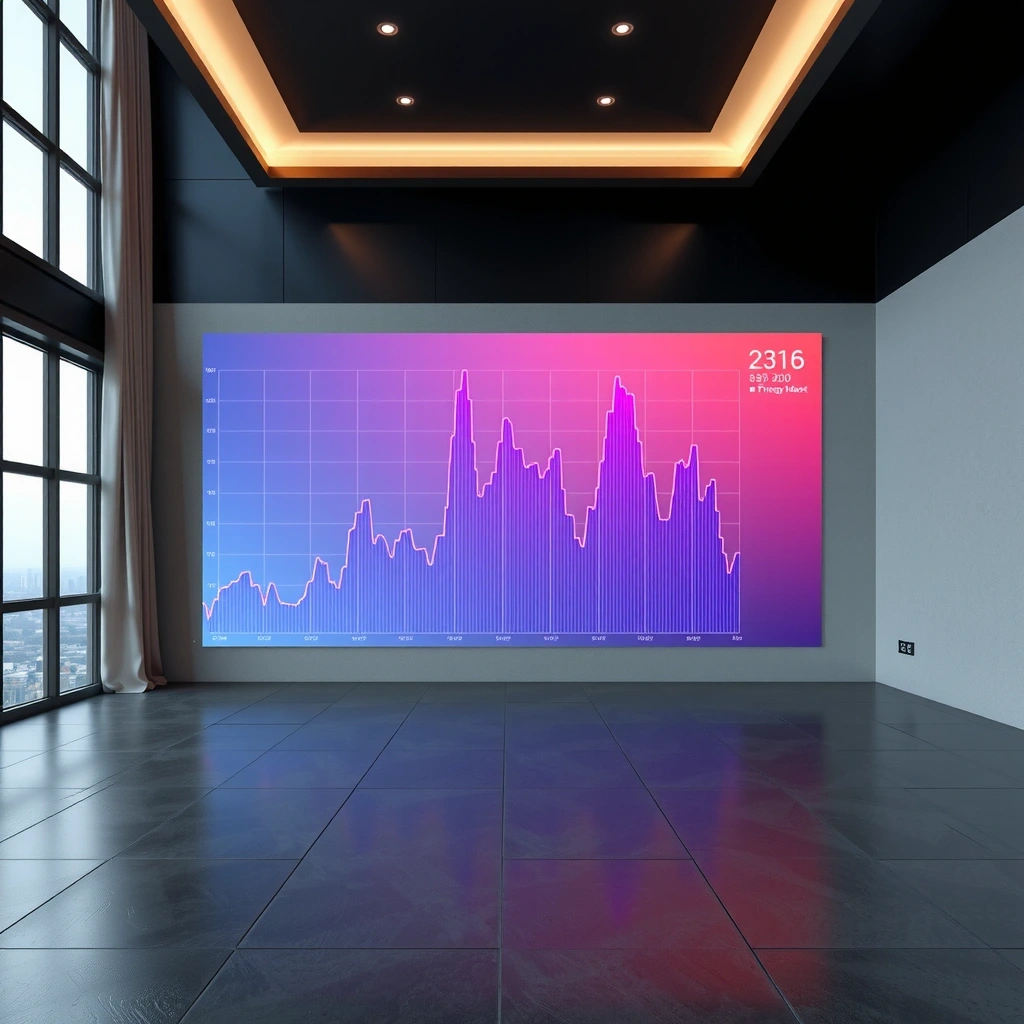
Static Market Chart
A conceptual rendering of market volatility and surge. Hover over the volatility nodes to reveal contextual insights about specific market phases. This visualization represents abstract data through geometric art.
Pharpily Studio Field Guide
Understanding Signal & Noise
In any visualized data stream, distinguishing meaningful patterns from random fluctuation is the primary challenge. The Candle Tracker operates on a similar principle: the burn rate determines the signal clarity.
- Slow Burn: High signal-to-noise ratio, predictable output.
- Steady Burn: Balanced state, optimal for observation.
- Rapid Burn: High variance, chaotic but potentially high-yield.
Decision Criteria
When interpreting the Market Chart, focus on three core metrics: Velocity (rate of change), Amplitude (deviation from mean), and Volume (participation level). A surge without volume is often a trap.
Myth vs. Reality
Quick Glossary
- Node
- Critical point of interest
- Surge
- Rapid vertical movement
- Consolidation
- Sideways accumulation
Operational Workflow
Define Parameters
Establish the primary objective and constraints. Select the volatility level appropriate for your current timeline.
Select Approach
Validate assumptions against historical patterns. Use the visual tracker to gauge potential energy output.
Apply Method
Execute the sequence. Observe the Market Chart nodes for real-time feedback on system response.
Review & Adjust
Analyze the results. If the signal remains noisy, return to Step 1 and recalibrate the burn rate.
The Malaang Philosophy
At Pharpily Studio, we believe in the principle of "Malaang"—the art of illuminating complex systems through simplified, intuitive interfaces. Whether tracking the burn of a candle or the surge of a market, clarity is the ultimate luxury.
- Visual abstraction of complex data
- Interactive metaphysical tools
- Focus on signal clarity
Pure Energy
Transforming raw data into visual insight.